Weekly Report December 3
For new readers of the blog, I recommend reading the terminology page before the weekly reports.
I’m going to take a quick look at the big picture.
Housing
Housing markets around the world are deflating at an alarming rate with Canada, Australia, Britain and Scandinavia taking the biggest hits so far. There’re also worrisome talks here in Hong Kong about real estate prices. Hong Kong residential housing prices have turned down and sales are starting to stall. Hong Kong is in a very difficult situation as the HKD is pegged to the USD which means that HK has to raise interest rates at the same rate as the US does. This means that even if the HK economy is stalling but the US is booming HK has to tighten into weakness. This is exactly what is happening here. HK has been in a major housing bubble amid the low cost of capital over the past 10 years. This era of low interest rates is now coming into its end and heavily indebted HK real estate investors are starting to feel the effects.
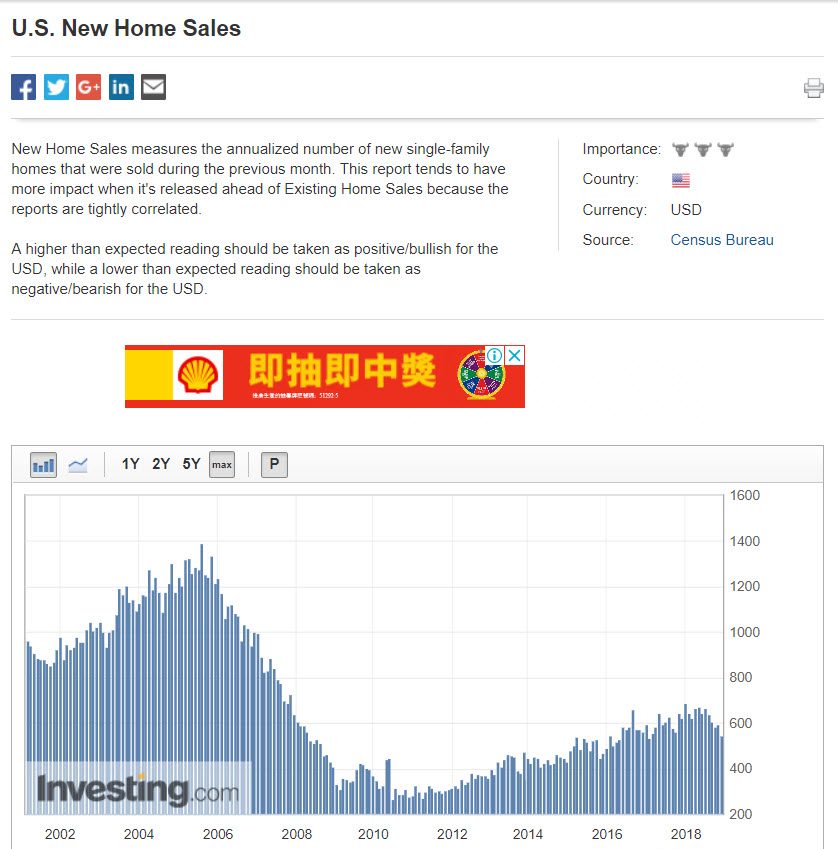
The whole housing market issue is internationally contagious and the situation in the U.S. is not much better as the New home sales have been disappointing 5 months in row. It is likely that the US housing market will enter a crisis if the Fed keeps on raising interest rates – more of which later in this post.
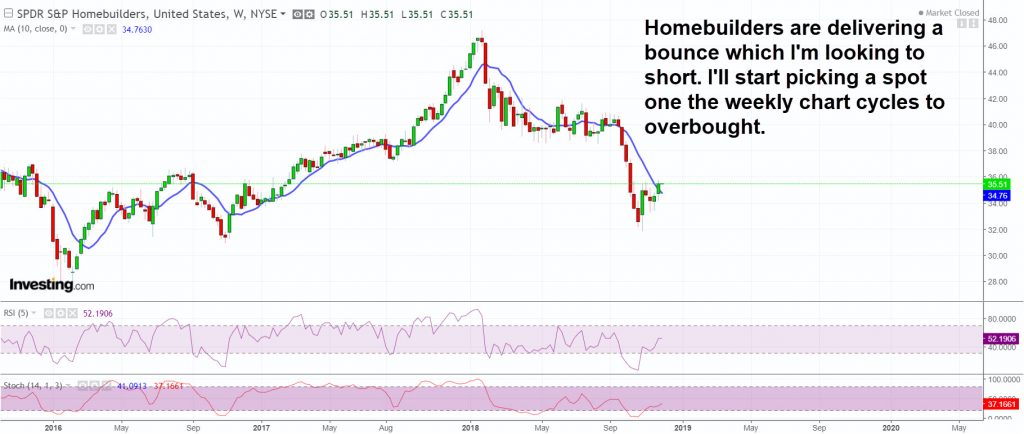
In the light of the current data I’m still looking for a spot to short the homebuilders ETF (XHB) as it’s currently delivering the bounce I’ve been looking for since late October. I’m doing some research on which stock in the EFT are in the worst shape but I’m quite likely to just go with the ETF as I’m not that interested in taking company specific risk.
I’ve been following the Vancouver housing market data intensively as prices in Vancouver are down almost 10% YoY, sale times are getting longer and inventory builds as sales stall. Vancouver is just another canary bird in the coal mine but a good one in my opinion as prices have been elevated for an extended period of time, it has been one of the first cities to show cracks and Vancouver didn’t that big of a blow in the 2007 housing crisis. I’ve used Zolo.ca to follow Vancouver housing figures in case you’re interested.
Stocks
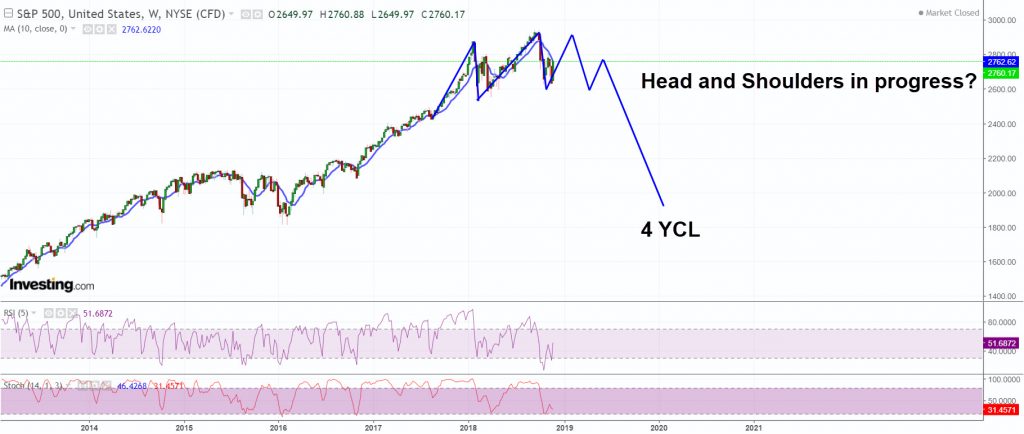
Stock indexes are bouncing, and the setup is bullish for the short term at least. I’m not fully convinced that the S&P will make it to all time high and even if it does, I’m not convinced that the S&P will make a sustainable breakout above 3000. As a matter of fact, the way I’m seeing it is that we’re likely to get a rally into the years end and complete the right shoulder of a large head and shoulders pattern.
As I mentioned in the November 12th Weekly Report there are worrying divergencies in the financials and the homebuilders – I urge you to take another look at that post. I just don’t see a scenario where most of the stock market in the US is in bear market territory, globally stocks are in a bad bear market and somehow the US indexes would just magically rise to new all time highs, break out and not care about the rest of the world.
Personally, I’m more in the camp which thinks that US stocks are in a large topping process, will roll over and start the pattern of lower lows and lower highs – a bear market. The next 4 year cycle low is due in 2020 so we’re getting into the timing band of having a bear market size correction. Economic data is showing US and global growth slowing and as mentioned above housing markets around the world are starting to crack badly. Couple that with one or more rate hikes from the Fed and you have a toxic environment of deflating asset prices coupled with higher cost of capital. Keep in mind that the Fed funds rate is only at 2% and we’re already seeing cracks around the world. The sick economy running on steroids will have a terrible downturn sooner than later and if you trust the cycles and look at everything what’s happening around the world, you’ll notice that we’re getting close to that event.
Gold
What a pickle this little bastard is.
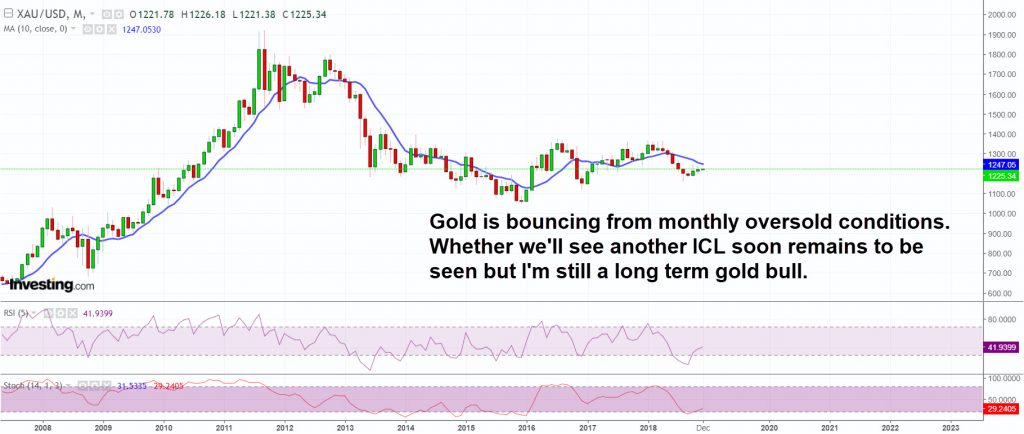
The monthly chart on gold is not bad as prices are recovering from oversold conditions however the intermediate cycle is getting mature being on week 16 with average intermediate cycles running between 25 and 30 weeks nowadays. The current top came on week 10 which means that this cycle is currently left translated. This means that in theory gold should break the August low in the next ICL. However, if gold would be able to print a new high above 1244 over the next few week then the chances are that gold will not drop below the August low in the next ICL.
It all remains to depend on the dollar and whether the USD remains strong. Taken that gold has a tendency to be weak in December I would remain cautious. Last intermediate cycle ran extremely long at 35 weeks and so we could see a short cycle which bottoms in December. On the other hand we maybe in process of generating a major bottom which warps the cycles the same way as the baby bull did in 2016. Frankly I have no idea. I’ve been buying some 24K gold jewellery here in HK but other than that I don’t really have directional bets on gold currently.
In short, gold is still stuck in no-man’s-land but that should change once the dollar starts to roll over.
Dollar
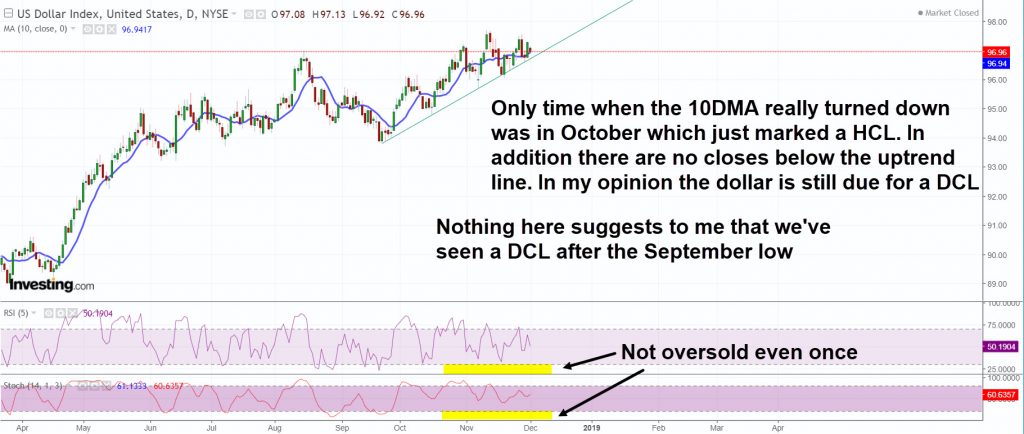
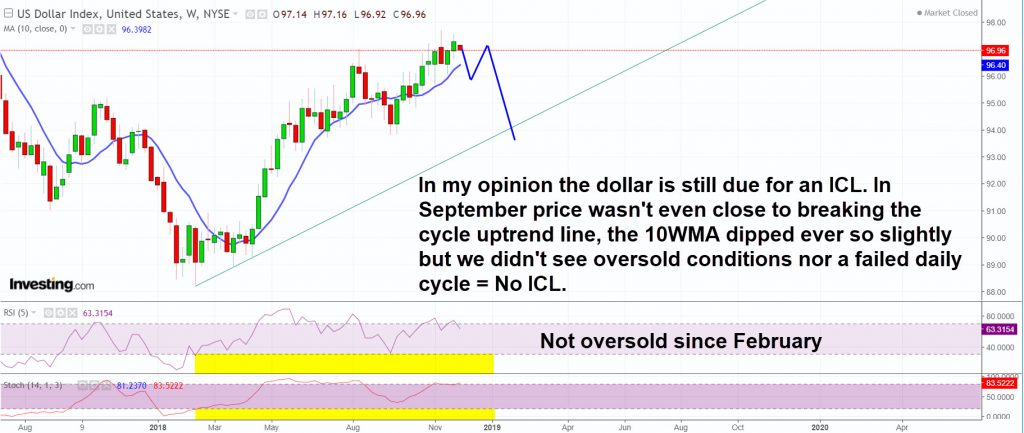
First of all, I don’t think that the dollar has printed its DCL nor its ICL yet. There’s nothing that suggest to me that we have a DCL or an ICL in place. The dollar has been hammering on a trendline with shortening intervals – knock on a door long enough and someone will open. I think that we are about to see a decline into a DCL which breaks the daily cycle uptrend line. What happens after that remains to be seen but the dollar is due for an ICL which should mean at least one failed daily cycle.
I’ve been bearish for the dollar for a long time already as many of you probably know. Now that the Fed is showing a more dowish tone the dollar is repricing fewer rate hikes for the upcoming years. The dollar sentiment is still overly optimistic and an ICL should reset that.
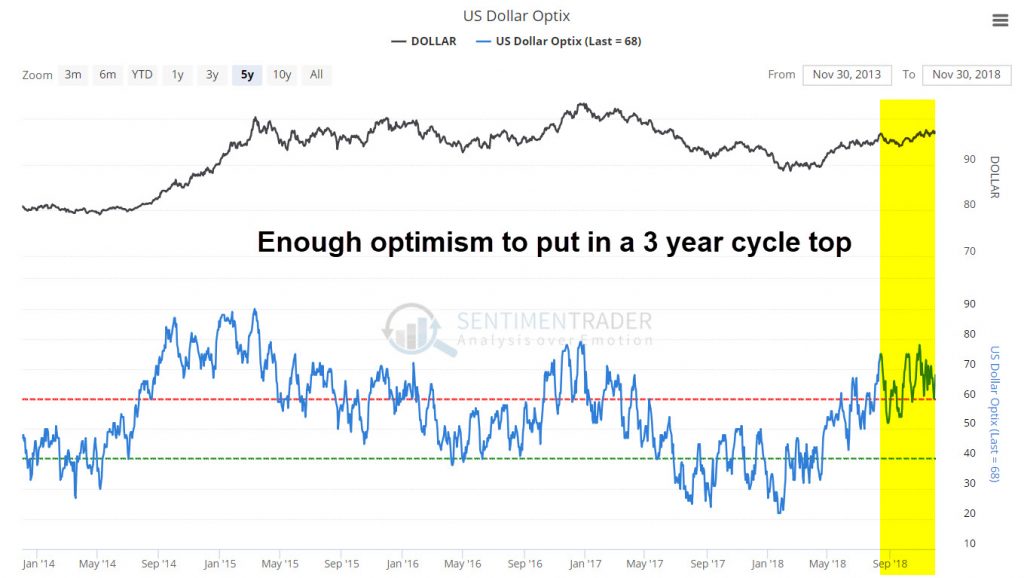
Source: Sentimentrader.com
Commodities
After seeing the action in oil this morning, I strongly believe that oil has finally found its DCL. This also means that the CRB has most likely found its DCL. Given that the 3 year cycle is mature, there’s a slight chance that the CRB has now found its 3 year cycle low. However, if the dollar remains strong and makes new high after a dip to a DCL CRB is likely to make new lows before the 3 YCL is in.
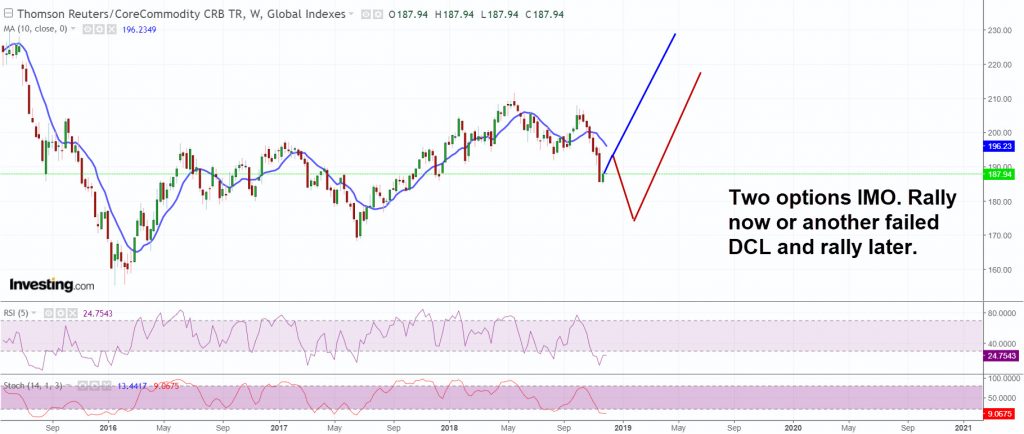
As I said in the November 12th Weekly Report make no mistake here. Once the 3 year cycle low is in place we’ll get another shot at 100% YoY oil. Once we get a bubble in oil, we’ll get a recession in the US. This is why I’m going to place a long oil trade this week. If the 3 YCL is in, we’ll see some fireworks in oil for sure. If not, it’s still a nice risk reward trade.
December Rate Hike
Albait the dovish tone of many Fed officials over the past two weeks, the market believes that the Fed will hike rates in December and so that’s what they’ll do. The times of Fed surprising the markets are long gone as uncertainty usually leads to bad outcomes in stocks. Currently the odds for another rate hike stand at close to 83%.
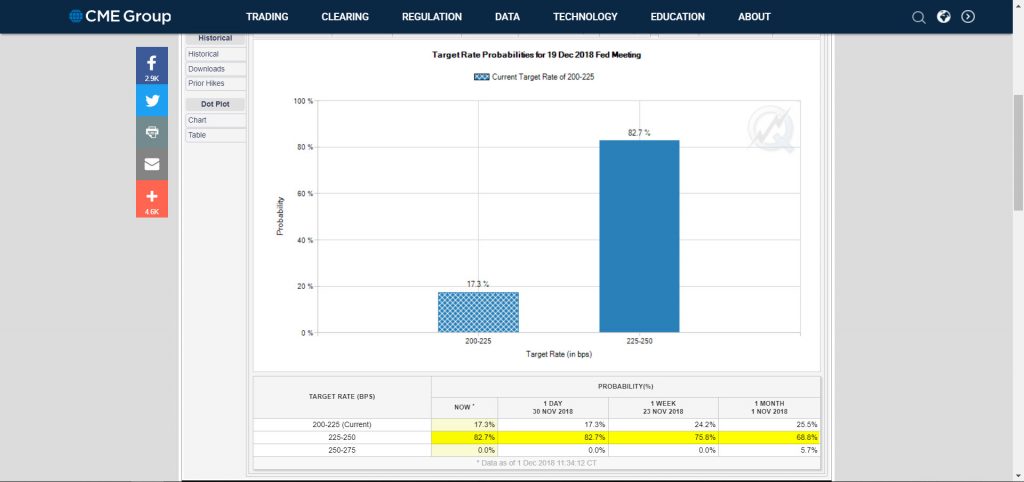
Source: CME Group
Thesis
I’ve been busy with my thesis thus no weekly reports. The thesis is 70 pages and 18 000 words into making and so far, I’ve interviewed Gary Savage from Smart Money Tracker, Alexis Stenfors from the University of Portsmouth, David Brady from Global Pro Trader, Jim Rogers (no introductions needed) and Brent Johnson aka @SantiagoAuCapital on Twitter. This week I have an interview with David Morgan and I’ll hopefully get some answers from a few other interviewee candidates. Busy times and the 100+ page thesis should be out in early January. For a Finn it’s a bit of an arrogant thing to say but I’m quite sure that my thesis will be the most extensive research paper on gold in the 21st century – remains to be seen. The thesis will be freely available, and I’ll add a link here as well once the thesis is out.
Want proof of the extensiveness of the report? Here’s the preliminary table of contents:
1 Introduction
2 Acknowledgements
3 Theoretical Framework
3.1 The Monetary Aspect of Gold
3.1.1 The Brief History of Gold as Money
The Classical Gold Standard
Gold Exchange Standard
The Bretton Woods
The Global Dollar Standard and The Era of Gold as a Reserve Asset
The Swiss Franc and Gold
Modern Gold Dinar
3.1.3 Central Banks
Central Bank Holdings
Accumulation of Gold by Central Banks
Repatriation of Gold by Central Banks
3.1.4 International Monetary Fund
3.2 Gold Markets
3.2.1 London Loco
3.2.2 Zurich Loco
3.2.3 COMEX
3.2.4 Shanghai Gold Exchange
3.3 Price Driving Fundamentals of the Gold Market
3.3.1 Gold’s Properties as an Element
3.3.2 Gold Demand
Jewellery Demand
Investment Demand
Technology Demand
Central bank Demand
3.3.3 Gold Supply
Mining output
Recycling
3.4 Why Financial Markets Are Inefficient
3.4.1 The Efficient Market Hypothesis
3.4.2 Grossman-Stiglitz Paradox
3.4.3 Financial Markets in Reality
3.5 Gold Market Manipulation
3.5.1 Previous Cases
3.5.2 COMEX Position Limits
3.5.3 Current Situation
Dumps in COMEX
London Gold Fix
Gold Market Characteristics
Yuan & Gold
Conclusion
3.5.4 Market Participants and Conclusion
3.6 The Foundation of Cycles and Sentiment Analysis
3.6.1 What Is Market Sentiment
3.6.2 How Do Cycles Appear on the Markets
The Rationale Behind Cycles
Interpretation of Cycles
Daily Cycles
Intermediate Cycles
Yearly Cycles
Multiyear cycles
Evolution of Cycles
3.6.3 Conclusion and Further Reference
4 Market Analysis
4.1 First Scenario: Fundamental Supply and Demand Drivers
4.1.1 Supply Trends
Minable Gold
Recycling and E-waste Mining
4.1.2 Demand Trends
Technology demand is Strong
Jewellery Demand is Growing
ETF Fund Flows
Central Bank Flows
4.1.3 Risks from Fundamental Perspective
4.1.4 Conclusion
4.2 Second Scenario: Resuming the Secular Bull Market
4.2.1 Driving Factors
Monetary Policies
Inflation
4.2.2 Cycles Analysis for Gold
Technical Trends
Gold Market Cycles
Gold’s ABC-wave
Gold Market Sentiment
1971 – 1980 Bull Market
4.2.3 Risks from Cycles Perspective
Strong Dollar
Technical Confirmation of a Bear Market
Manipulation Intensifies
4.2.4 Conclusion
4.3 Third Scenario: Monetary System Reform
4.3.1 China, Russia and Trade Partners
Trustworthiness of the Chinese Government and Gold
No Poverty in China by 2020
4.3.2 Iran and U.S. Sanctions
4.3.3 Risks from Monetary Perspective
4.3.4 Conclusion
4.4 Results and the Most Likely Outcome
5 Discussion
References
Appendices
Appendix 1. Vocabulary
Appendix 2. Gold Market Demand and Supply Trends
If you’re interested in the progress of my Thesis you can follow me on Twitter @SamLaakso
And as always be sure to follow @SKALCapital on Twitter for instant notifications on new posts on this blog.