The Rubber Band Theory
There are two main forces driving the markets: Cycles and Sentiment. These forces are the foundation of the market action and are the root of the rubber band theory. Think of a stretched rubber band. It is loaded with force which urges to release and upon release the rubber band gets shot across the room. It is this force which creates cycles to the market. The rubber band theory is the force which creates opportunities and volatility to the market. As I explained in the ‘What are Cycles?‘ article, the market is a natural entity which has a tendency to regress to mean. In the markets, this mean can be expressed easily for example as a moving average. When price stretches far enough from the moving average, price will most likely stretch as far to the other side of that moving average in the future. Now think of a pendulum, it swings from one side to the other and back. This is what cycles analysts call a cycle and the rubber band theory is like a pendulum swinging back and forth again and again. Even though the rubber band theory is most useful when looking for big and long-lasting moves, the theory can be applied to all time frames from days to weeks to even multiple years.
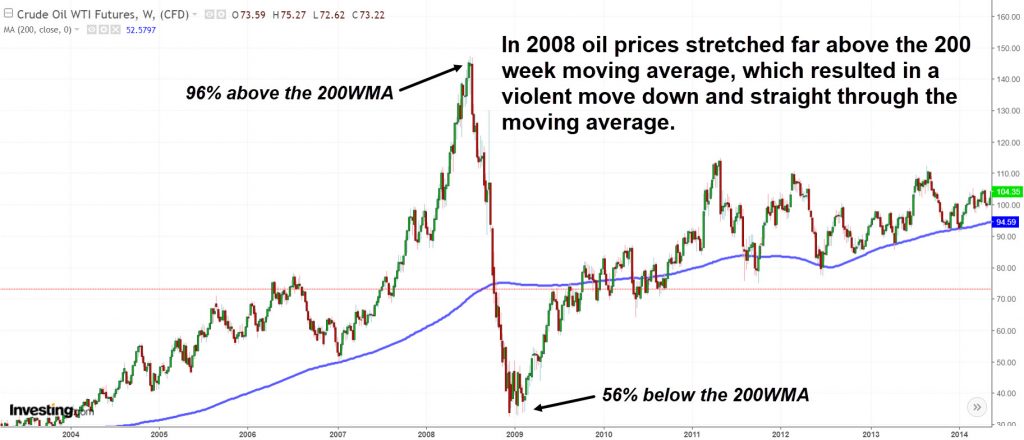
How does the rubber band theory actually work? First of all, in the markets there are two ways to wind the rubber band. The first one is to stretch the rubber band far enough to one side. This builds up hidden energy and once that energy is released the rubber band ejects violently to the opposite direction. This is the most common way of creating a big move in the markets and bubbles are a perfect example of this. Below you can see a clear example of the rubber band theory in action. When oil prices stretched too far from the mean in 2007 and 2008, this generated a massive amount of hidden energy which upon release, resulted into a violent crash. In just 161 days, oil suffered a 78% drawdown. As the pendulum swung to the other side yet again, energy built up and resulted in another big move upwards in 2009.
The second option is what is also known as a volatility collapse. As I’ve said before, everything is cyclical. Easier markets are often followed by harder markets and the same applies to volatility. Periods of low volatility are often followed by periods of higher volatility and vice versa. The volatility collapse can be seen as a coil being wound up day after day. As the coil is wound, hidden energy is building up. At some point the coil cracks from the pressure and releases all of its power. If you’ve ever overwound a coil, you might know that the coil doesn’t unwound nice and smooth but most often goes with a big bang.
You might also have heard someone say that risk will build up slowly and realize quickly. This is exactly what happens, once the coil breaks and you release the rubber band.
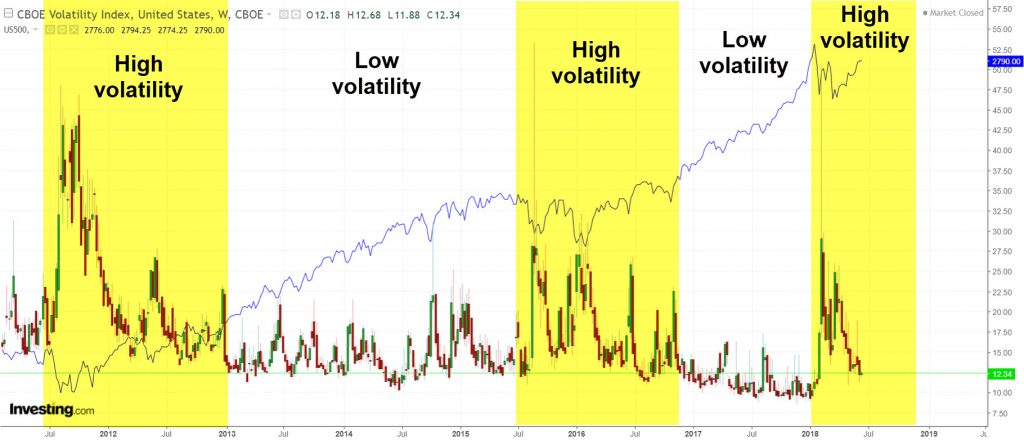
The most recent example of a volatility collapse was back in 2017 in the US stock market. The VIX-index, which measures the implied volatility of the S&P500 stock market index, stayed below 18 throughout 2017. As time passed by, the coil wound tighter and tighter and in February 2018, the coil cracked releasing the power which had been building up for the past year. The VIX-index spiked past 50 and we entered a period of higher volatility. The pendulum swung to the other side.
So you can see, it all comes down to balance. Nature is in balance and so are the markets. When imbalance occurs, that creates opportunities for traders. Oil rose over 100% in the year following the 2008 bottom and the S&P500 rose over 10% in 11 trading days following the February bottom. In my opinion, understanding the rubber band theory is one of the most important steps in becoming a successful trader. Whether we are in a bull market or a bear market it does not matter as long as you know how the markets operate.
To receive instant notifications on new posts, follow SKAL Capital on Twitter.